
Best TradingView Indicators for Swing Trading in India (2026 Guide)

Swing trading is one of the most searched trading styles in India right now, and for good reason. You do not need to watch the screen all day like an intraday trader, and you do not need to wait years like a long-term investor. You hold a stock for a few days to a few weeks and try to catch one clean move.
The hard part is timing: where to buy, and where to sell. That is exactly what technical indicators on TradingView help with. In this guide we cover the best TradingView indicators for swing trading Indian stocks, how each one works, how to combine them into a simple daily routine, and the mistakes that cost new swing traders the most money.
This article is for education only. It is not investment advice, and BCB Elevate is not a SEBI-registered investment adviser. Trading involves risk, including the loss of your capital.
What is swing trading?
Swing trading means buying a stock when it pulls back or starts a new move, and selling it after a "swing" of a few days to a few weeks. Swing traders usually work on the daily chart, check their charts once a day after the market closes, and place orders for the next session.
Compared with other styles:
- Intraday trading closes every position the same day. It needs constant screen time and is very sensitive to costs and noise.
- Swing trading holds for days to weeks. One check per day is usually enough.
- Long-term investing holds for years and focuses more on business fundamentals than on chart timing.
Because swing traders decide once a day, the right indicators make a big difference: they turn a noisy chart into a short list of clear decisions.
What makes a good swing trading indicator?
Before you add anything to your chart, check it against these five points:
- It works on the daily chart. Swing trading lives on daily candles. An indicator tuned for 1-minute scalping will give you far too many signals.
- It confirms on candle close. Some indicators "repaint": a signal appears during the day and then disappears. A good swing trading indicator only finalises its signal when the daily candle closes.
- It gives clear entries and exits. An indicator that tells you where to buy but never where to sell leaves you holding stocks with no plan.
- It fits your risk plan. You still need to know how much to buy and how much you are willing to lose.
- It supports alerts. TradingView alerts (on paid plans) mean you do not have to check every chart by hand.
The best TradingView indicators for swing trading
1. Moving averages (20, 50 and 200 EMA)
Moving averages are the foundation of most swing trading systems. They smooth out price so you can see the trend clearly.
- The 20 EMA shows the short-term swing. In a strong uptrend, pullbacks often find buyers near it.
- The 50 EMA shows the medium-term trend. Many swing traders only buy when price is above the 50 EMA.
- The 200 EMA shows the long-term trend. Stocks below their 200 EMA are usually best avoided for long swing trades.
How to use it: look for stocks where the 20 EMA is above the 50 EMA, and wait for price to pull back towards the 20 or 50 EMA before buying. People often ask for the "best moving average for swing trading"; there is no magic number, but the 20 and 50 EMA pair is the most widely used starting point.
2. RSI (Relative Strength Index)
RSI measures how strong recent up moves are compared with down moves, on a scale of 0 to 100. Readings above 70 are often called overbought and readings below 30 oversold.
How swing traders use RSI:
- In an uptrend, RSI dips towards 40 to 50 often mark good pullback entries.
- RSI rising back above 30 after a sharp fall can show selling pressure easing.
- Divergence, where price makes a new low but RSI makes a higher low, can warn that a fall is losing strength.
RSI on its own gives many false signals in strong trends, so combine it with the trend (moving averages) rather than using it alone.
3. MACD
MACD compares two moving averages to show momentum. The MACD line crossing above its signal line is a common bullish signal, and crossing below is bearish. On the daily chart, MACD crossovers work best in the direction of the main trend, for example bullish crossovers while price is above the 50 EMA.
4. Volume and VWAP
Price moves on high volume are more trustworthy than moves on thin volume. Add the standard Volume indicator and look for:
- breakouts above resistance on above-average volume;
- pullbacks on falling volume, which often means sellers are not aggressive.
VWAP and volume profile are popular on TradingView too. VWAP is mostly an intraday tool, but anchored VWAP from a major low or high is useful for swing traders to see where the average buyer is in profit or loss.
5. Support and resistance
Support and resistance are price zones where a stock has repeatedly turned. You can draw them by hand, or use one of the many support and resistance indicators on TradingView.
Swing traders like to buy near support with a clear invalidation point just below it, and take profit near the next resistance. This gives every trade a defined risk and target before you enter.
6. Bollinger Bands
Bollinger Bands place a band two standard deviations above and below a 20-period average. When bands squeeze tightly, a big move often follows. In an uptrend, touches of the lower band can be pullback opportunities; in a downtrend, the upper band often caps rallies.
7. ATR (Average True Range)
ATR measures how much a stock typically moves per day. It does not give buy or sell signals, but it is one of the most useful indicators for risk management:
- place a stop-loss 1.5 to 2 ATR away from your entry, so normal daily noise does not knock you out;
- size your position so that the distance to your stop equals a fixed share of your capital, such as 1%.
8. Buy sell signal indicators
Many traders search for a single buy sell indicator that combines several conditions and simply marks Buy and Sell labels on the chart. These can save a lot of time, because the indicator does the scanning and you make the decision.
When you choose one, apply the checklist above, and be careful:
- Avoid anything advertised as "100% accurate". No indicator is right every time, and that claim alone is a red flag.
- Prefer indicators that show their past results honestly, including the losing trades.
- Check whether signals repaint. Signals should be final once the candle closes.
SwingScan Pro: buy and sell signals for swing trading
Buy 1, Add on dips and Exit all labels on any NSE, BSE, NYSE or NASDAQ stock, with shares to buy from your capital and a summary at every exit.
SwingScan Pro: a buy sell indicator built for swing trading
We built SwingScan Pro for exactly this style of trading. It is a TradingView indicator that marks buy and sell signals on any NSE, BSE, NYSE or NASDAQ stock, designed around a simple swing plan:
- Buy 1 starts a position when a pullback shows signs of turning back up.
- Add 2, Add 3 and so on mark further dips, so you can build the position in stages instead of all at once.
- Exit all marks where to sell the whole position, with a cycle summary showing the buys, shares, average cost and the profit or loss.
- Enter your capital in the settings and every Buy shows how many shares to buy.
- A results panel shows the open position and the results of every past cycle on that stock, including the losing ones.
- Signals are confirmed on candle close, and you can get TradingView alerts on your phone with a paid TradingView plan.
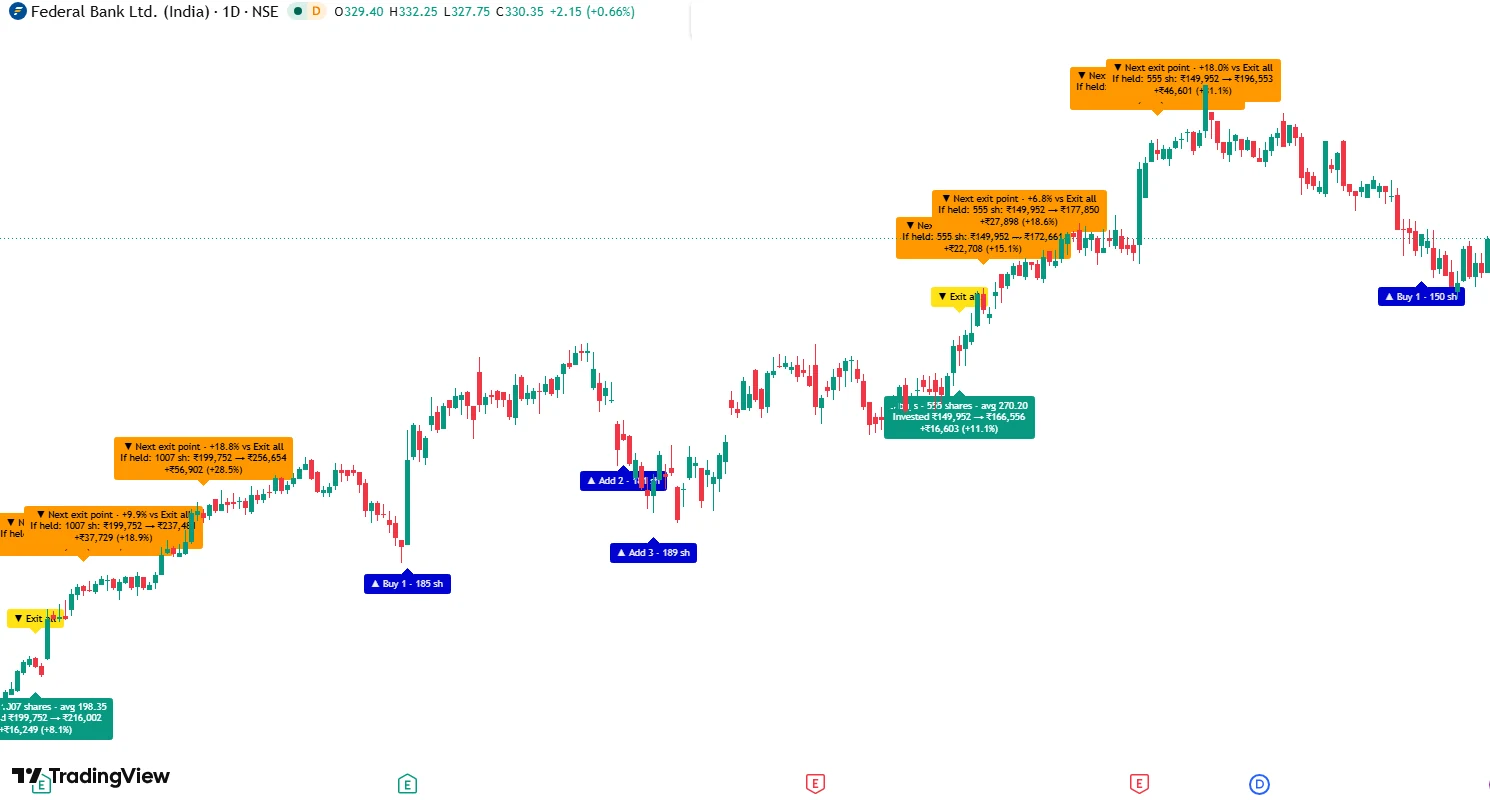
SwingScan Pro is an educational tool, not investment advice. It does not set a stop-loss, so you remain responsible for your position size and risk. See how it works on a real chart.
How to combine indicators: a simple daily swing trading routine
More indicators do not mean better trades. Three or four that each do a different job is plenty. Here is a routine you can run in 15 minutes after the Indian market closes at 3:30 pm:
- Trend filter: only look at stocks trading above their 50 EMA, and ideally above the 200 EMA.
- Pullback: look for price pulling back to the 20 or 50 EMA or to a support zone, with RSI cooling down rather than collapsing.
- Trigger: wait for a clear signal on a closed daily candle, such as a bullish candle off support, a MACD crossover or a Buy label from your buy sell indicator.
- Risk: set your stop-loss below support or 1.5 to 2 ATR away, and size the position so a stop-out costs no more than 1 to 2% of your capital.
- Exit plan: decide your target (next resistance, or a Sell signal) before you enter.
- Alerts: set TradingView alerts so you are notified instead of watching the screen.
Setting up TradingView for swing trading
- Open a chart in TradingView and choose the 1D (daily) timeframe.
- Click Indicators and add your moving averages, RSI and Volume. For invite-only indicators such as SwingScan Pro, open Indicators → Invite-only scripts after access is granted.
- Save the layout as a template so every chart opens with the same setup.
- Build a watchlist of liquid stocks, for example Nifty 50 or Nifty 100 names, so you trade stocks with tight spreads and enough volume.
- Create alerts: right-click the indicator or price level and choose Add alert. Indicator alerts need a paid TradingView plan.
A free TradingView account is enough to start. Paid plans add more indicators per chart, more alerts and screeners.
Is there a 100% accurate buy sell indicator?
No. Every indicator is built from past prices, and markets change. Some signals will fail, and a losing streak is normal even with a good method. Searches for "100% accurate buy sell indicator" are common, and so are products that promise it. Treat any such promise as a warning sign.
What you can control is:
- how much you risk on each trade;
- whether you follow your plan consistently;
- how you choose stocks, sticking to liquid stocks in clear trends.
A modest edge, combined with strict risk control, is what keeps swing traders in the game long enough to benefit from it.
Swing trading Indian stocks: points to remember
- Liquidity matters. Thinly traded small caps can gap sharply and are hard to exit. Beginners do best with large and mid caps.
- Price bands. Many NSE and BSE stocks have daily price bands (circuit limits). A stock locked in a circuit can be impossible to sell that day.
- Costs add up. Brokerage, STT, exchange charges, stamp duty and GST all reduce returns, especially on small positions. Include them when you judge a strategy.
- Gaps happen. Results, news and global markets can gap a stock past your stop-loss overnight. Position size is your real protection.
- Taxes. Profits on shares held for less than a year are taxed as short-term capital gains. Check the current rules with a tax professional.
- Get qualified advice. For personalised investment advice, consult a SEBI-registered investment adviser.
Common swing trading mistakes
- Using too many indicators. Ten indicators that all say the same thing add confusion, not confidence.
- Trading every signal. Filter signals by trend and liquidity first.
- No exit plan. Decide your stop and target before you buy.
- Averaging down without a limit. Adding on dips can work in an uptrend, but without a cap on total position size it can turn a small loss into a large one.
- Ignoring costs and taxes. A strategy that looks profitable before costs may not be after them.
- Judging a method on a few trades. Look at many trades over different market conditions.
Frequently asked questions
Which is the best TradingView indicator for swing trading?
There is no single best indicator for everyone. A strong starting set is the 20 and 50 EMA for trend, RSI for momentum, Volume for confirmation and ATR for stop-loss placement. A buy sell indicator such as SwingScan Pro can combine signals into clear Buy and Sell labels on the daily chart.
Which timeframe is best for swing trading?
The daily chart is the standard for swing trading. Many traders also check the weekly chart for the bigger trend before taking a daily signal.
What is the best moving average for swing trading?
The 20 EMA and 50 EMA are the most widely used. The 20 EMA tracks short swings, and the 50 EMA defines the medium-term trend. The 200 EMA is a useful long-term filter.
Is RSI good for swing trading?
Yes, as a momentum tool. RSI pullbacks to 40 to 50 in an uptrend and bullish divergences are popular swing setups. It works best alongside a trend filter such as moving averages.
Do I need a paid TradingView plan for swing trading?
No. The free plan is enough to chart and use indicators. Paid plans add more indicators per chart, more alerts, and indicator-based alerts on your phone.
Can I use these indicators for intraday or options trading?
The settings in this guide are aimed at daily-chart swing trading of stocks. Intraday and options trading need different timeframes and risk management, and options carry additional risks.
Conclusion
The best TradingView indicators for swing trading are not secret or complicated: moving averages for trend, RSI and MACD for momentum, volume for confirmation, support and resistance for structure, and ATR for risk. Combine three or four of them into a simple daily routine and stick to strict position sizing.
If you want buy and sell signals marked for you on any Indian or US stock, with the shares to buy and a summary at every exit, take a look at SwingScan Pro. You can also learn how to size positions safely in our guide to risk management and position sizing.
Disclaimer: This article is for educational purposes only and is not investment advice or a recommendation to buy or sell any security. BCB Elevate is not registered with SEBI as an investment adviser or research analyst. Indicator signals can be wrong and past results do not guarantee future results. Trading involves risk, including the loss of your capital. Consult a SEBI-registered investment adviser before investing.
Written by BCB Elevate Team
Providing institutional-grade trading algorithms and insights to help you elevate your financial performance.
Swing trade with clear buy and sell signals
SwingScan Pro marks Buy 1, Add on dips and Exit all on any Indian or US stock in TradingView, with the shares to buy and a summary at every exit.
Have Questions About This Strategy?
Our team is available 24/7 on WhatsApp to help you set up your automated trading tools or answer any queries.
Chat on WhatsApp